.jpg)
Checking Course Statistics
Monitoring course statistics is essential for understanding how your academy is performing. The statistics section gives you detailed insight into learner activity, engagement, and overall progress, helping you make informed decisions to improve your courses and learning outcomes.
1. Accessing Overall Statistics
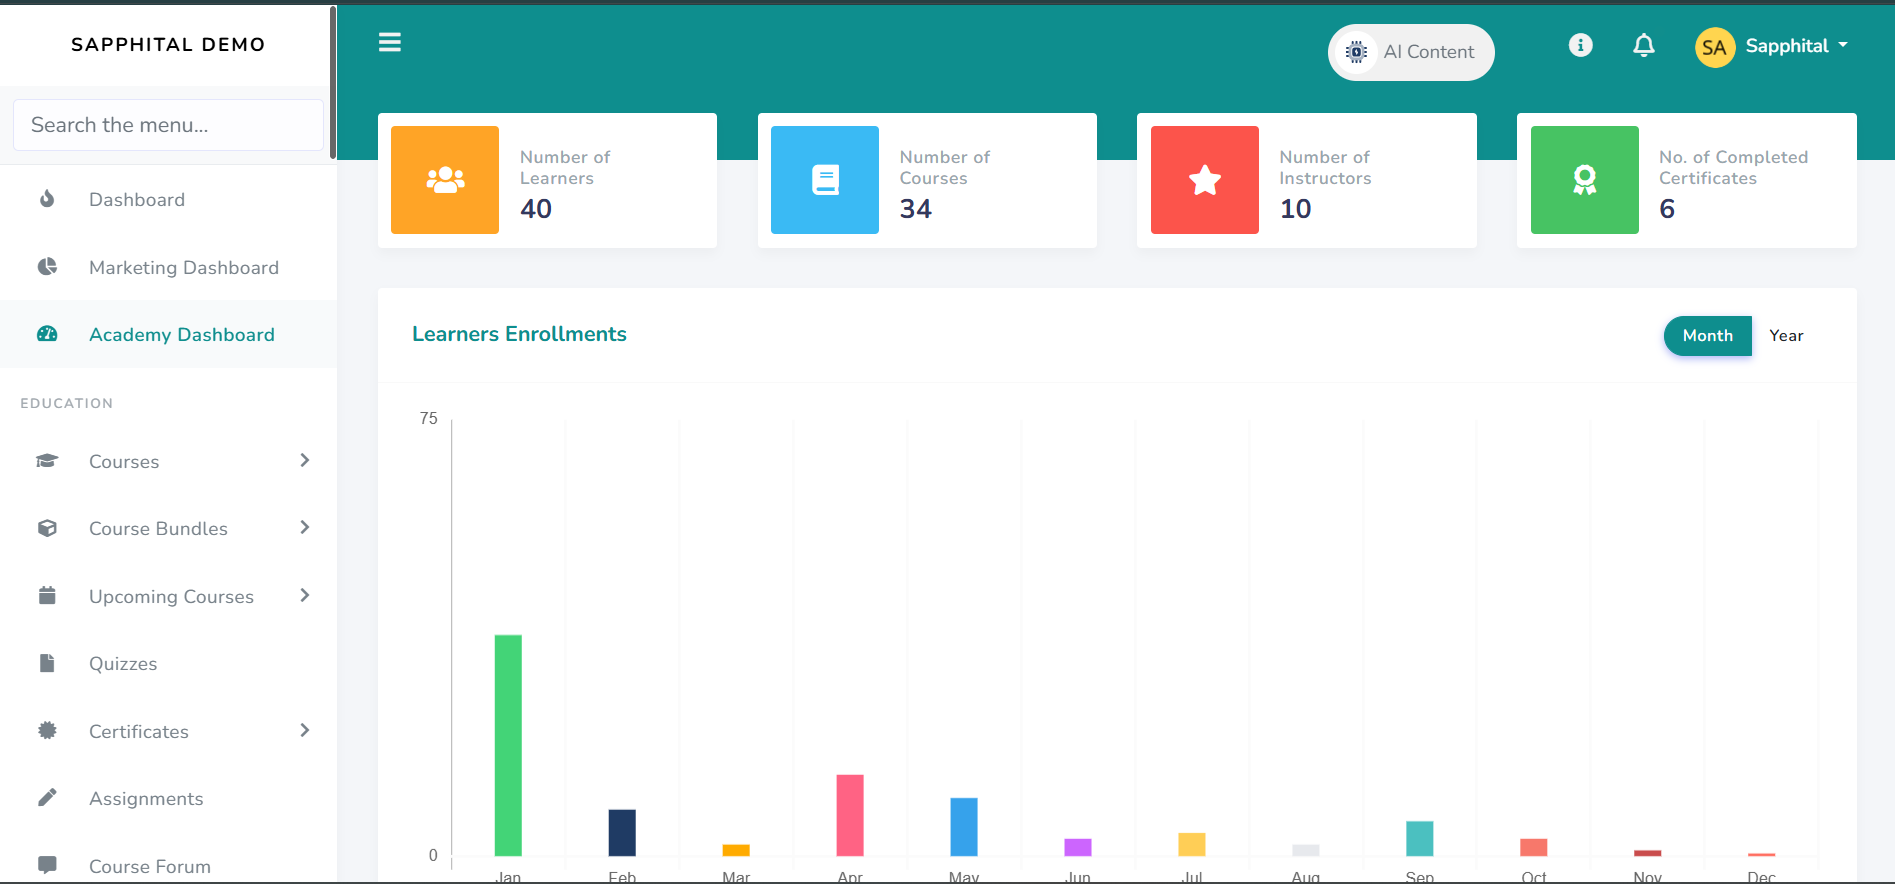
After logging in to the Admin Academy Dashboard, you’ll immediately see a summary of your academy’s performance.
This overview includes key metrics such as:
Number of Learners – The total count of all registered learners on your platform.
Number of Courses – The total number of courses currently active or published.
Number of Instructors – Displays how many instructors are registered and teaching on your platform.
Number of Completed Certificates – Shows how many certificates have been issued upon successful course completions.
You’ll also find additional reports and insights such as:
Learner Enrollments – Displays how many learners are actively enrolling in courses over time.
Certificate Reports – Gives a breakdown of certificates issued per course or instructor.
Highest Completion Courses – Highlights the courses with the best completion rates.
Most Active Learners – Shows which learners are most engaged across your academy.
Most Active Courses – Displays which courses are generating the most participation.Most Recent Enrollments – Lists the latest learner sign-ups to help track ongoing activity.
This dashboard snapshot provides a quick but comprehensive overview of your academy’s performance at a glance.
2. Viewing Statistics for a Specific Course
If you want to review statistics for a particular course, follow these steps:
Go to the Courses section from your admin menu.
Locate the course you’d like to analyze.
Click the three dots (⋮) icon next to that course.
Select Statistics from the dropdown menu.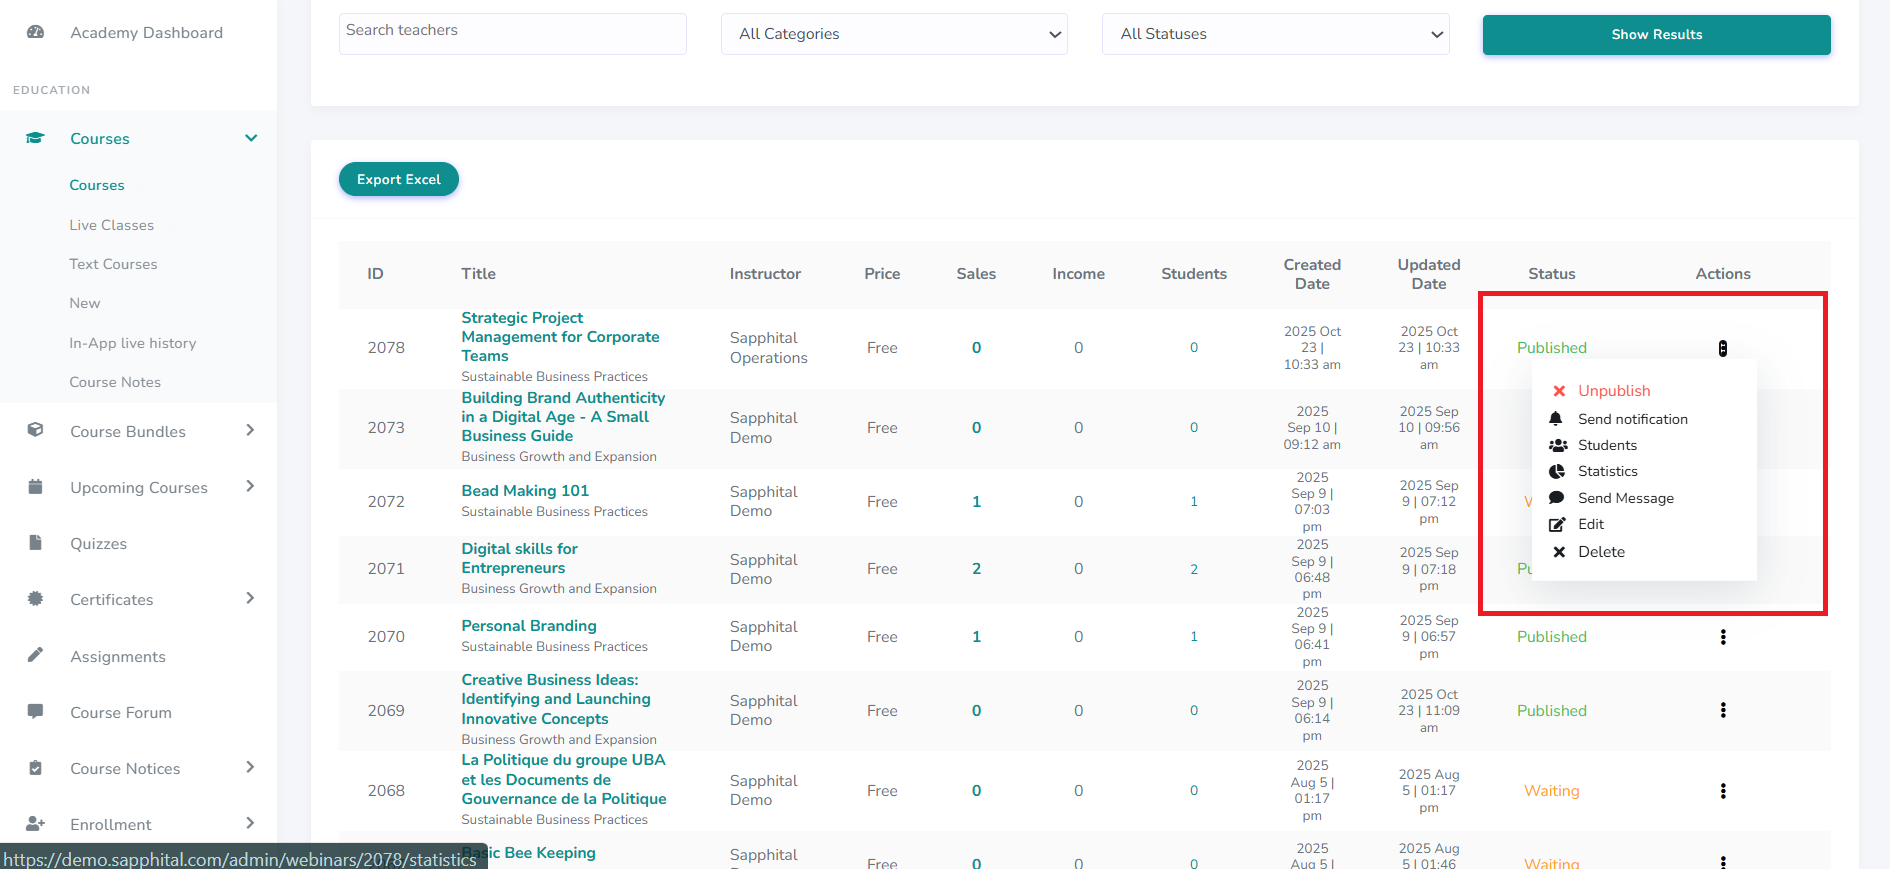
Once opened, you’ll be presented with detailed analytics for that specific course — including data such as:
Total Enrollments
Quiz Performance and Status
Assignment Submissions
Completion Rates
Active Learners
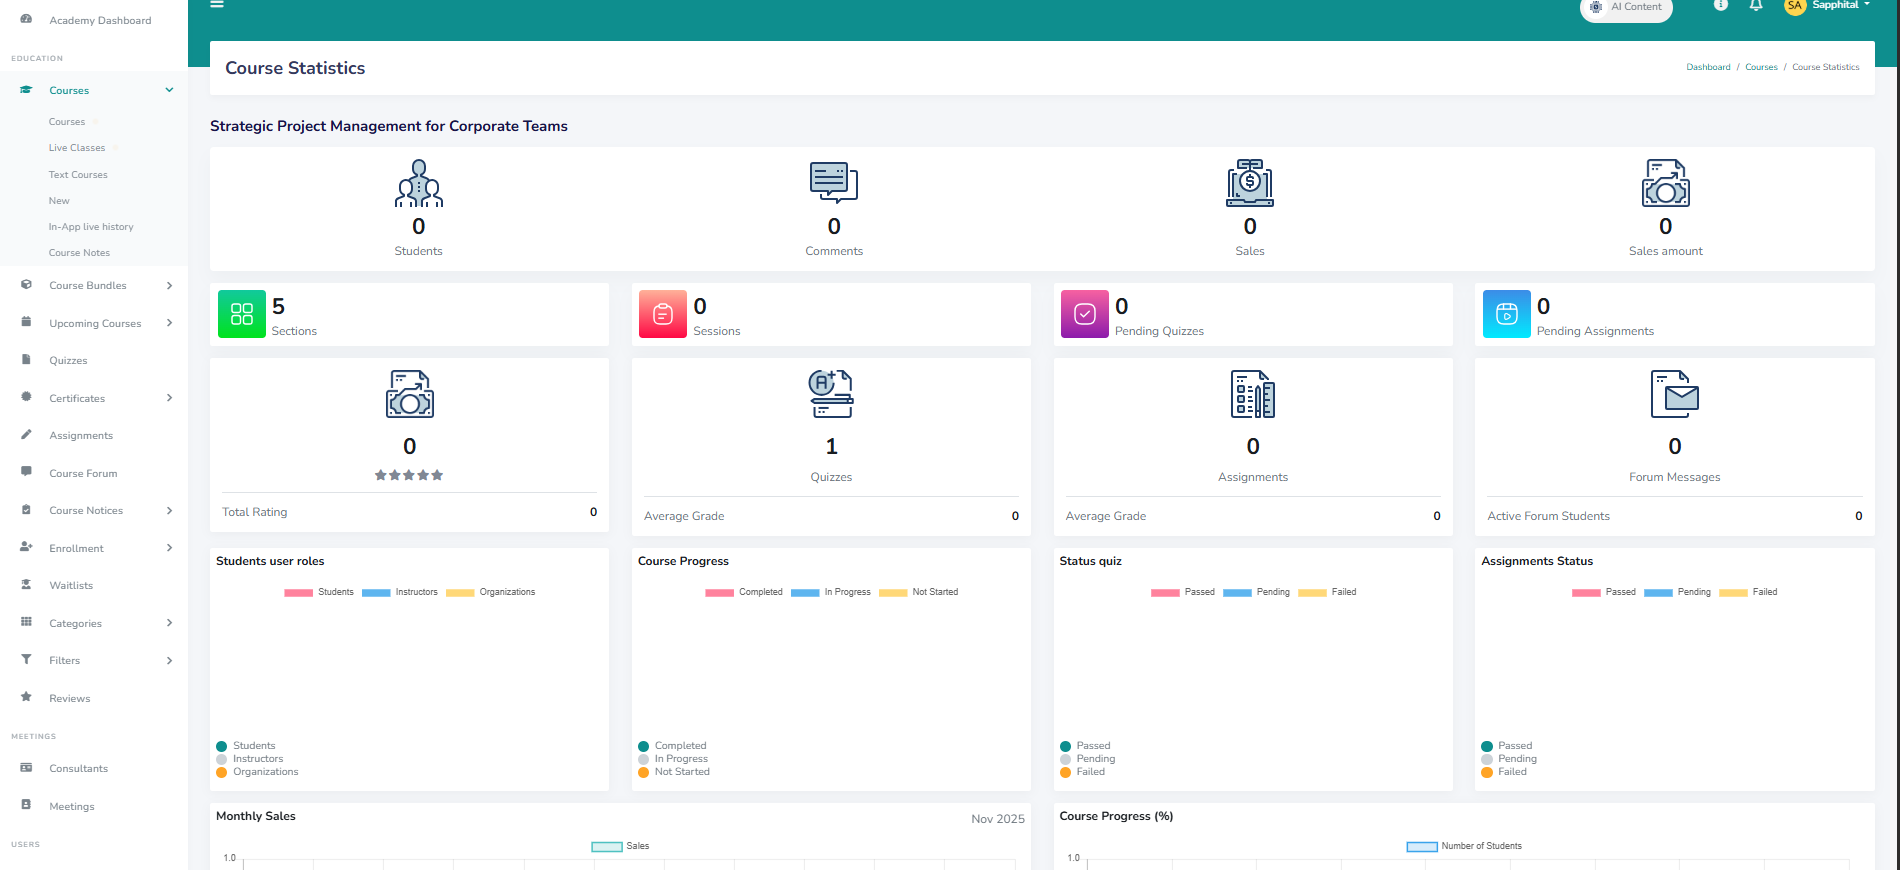
These insights help you measure engagement, identify successful content, and spot areas that may need improvement.
3. Why Course Statistics Matter
Tracking statistics allows you to understand how learners are interacting with your courses. You can see which lessons drive the most engagement, which quizzes challenge students, and which instructors have the highest completion rates. By monitoring these numbers regularly, you can make data-driven adjustments improving course quality, learner satisfaction, and the overall success of your academy.
Comments (0)

Categories
Recent posts
.jpg)
Customizing Colors and Logo
5 Nov 2025.jpg)
Using the Noticeboard and Notifications
6 Nov 2025
Enrolling Learners in the LMS
6 Nov 2025